Once when I was six years old I saw a magnificent picture in a book […] about the primeval forest. It was a picture of a boa constrictor in the act of swallowing an animal. […] I pondered deeply, then, over the adventures of the jungle. And after some work with a colored pencil I succeeded in making my first drawing. […] I showed my masterpiece to the grown-ups, and asked them whether the drawing frightened them. But they answered: “Frighten? Why should any one be frightened by a hat? My drawing was not a picture of a hat. It was a picture of a boa constrictor digesting an elephant.
[Antoine de Saint-Exupéry, The little prince]
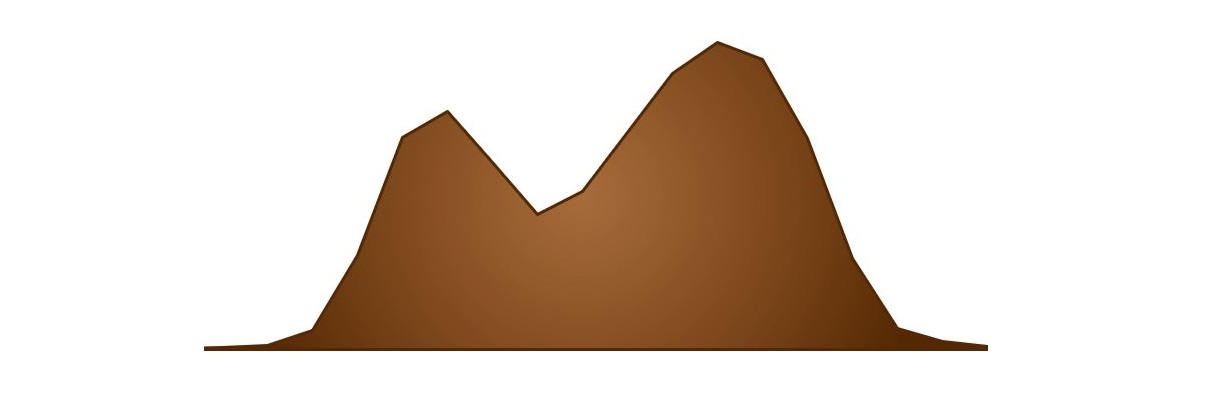
Our picture is neither the drawing of a hat nor the drawing of a boa that digests an elephant.
It is the graph of the hourly distribution of the entrances of a shopping center. To be more precise, it is the graph of the average entrances on Sundays in May 2019 for a sample of more than 45 Italian shopping centers, grouped by hours.
In May 2019 the analyzed sample of Italian Malls recorded + 3.17% of visitors (from 08:00 to 23:59), if compared to May 2018, excluding May 1st, which is a festivity in Italy. The variation on the entrances, calculated by day of the week, presents a surprisingly variable picture, which is shown in the table.
| comparison | percentage |
|---|---|
| Monday May 2019 vs Monday May 2018 | +2,13% |
| Tuesday May 2019 vs Tuesday May 2018 | -2,12% |
| Wednesday May 2019 vs Wednesday May 2018 | -0,86% |
| Thursday May 2019 vs Thursday May 2018 | -1,10% |
| Friday May 2019 vs Friday May 2018 | -0,52% |
| Saturnday May 2019 vs Saturnday May 2018 | +6,69% |
| Sunday May 2019 vs Sunday May 2018 | +11,91% |
One factor that maybe strongly affected these numbers were the adverse weather conditions. Exceptional cold, low-level snowfalls, heavy rain. It seems that in May 2019, sun and spring have decided to play hide and seek in Italy, especially on weekends.
So a new question has arisen: how the habits of Italians have changed with respect on May 2018? What time do they decided to go to the malls?
Let’s ask the data.
The following table shows the distributions of the input entrances from 8:00 am to 11:59 pm, for May 2018 (light color) and May 2019 (dark color), broken down by day of the week.
| day of the week | plot |
|---|---|
| Monday +2,13% |  |
| Tuesday -2,12% |  |
| Wednesday -0,86% |  |
| Thursday -1,10% |  |
| Friday -0,52% |  |
We can note that on Monday, the only weekday day with a positive variation, the increase in the number of visitors occurred in the central hours of the day, that is from 10:00 am to 05:00 pm, at the expense of a deflection from 06:00 pm to 09:00 pm.
On other weekdays, the losses in terms of visitors occurred mainly from 9:00 am to 11:00 am and from 5:00 pm to 9:00 pm, around the hours with the highest footfall and in the evening.
Let’s move on to analyzing weekend distributions.
| Saturnday +6,69% | 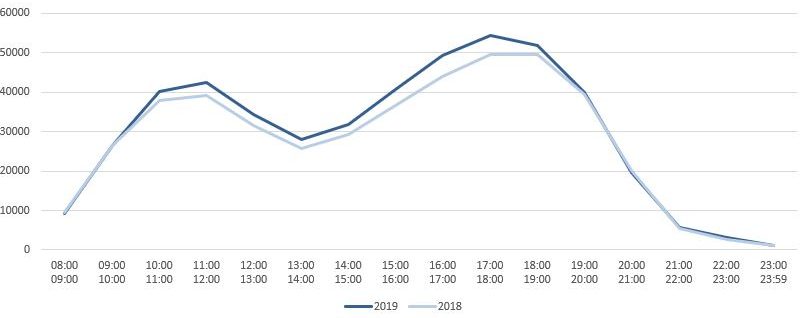 |
| Sunday +11,91% | 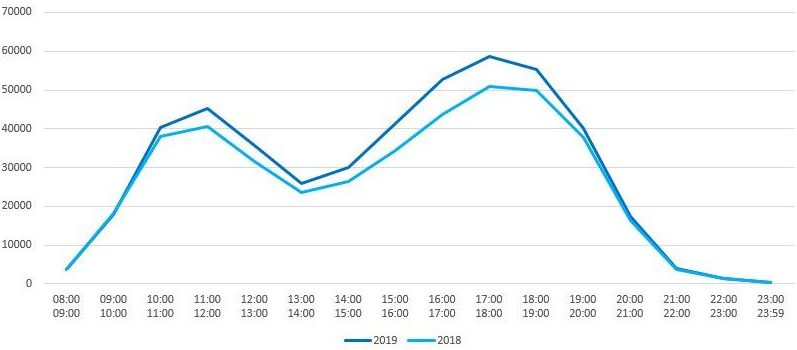 |
From the graphs we can see that the increases were recorded especially in the central hours of the day, from 10:00 am to 07:00 pm for Saturday and from 10:00 am to 08:00 pm for Sunday.
What can we conclude? Mainly two things.
Italians are not early risers.
In data analysis we should always go beyond the surface of things. Otherwise we risk not being able to grasp what we do not see at first sight, because our mind tends to make judgments based on the appearances it perceives, in the same way as described in The little prince. Another example? The statement of the previous point is not correct: from the data of the visitors of shopping centers we cannot know what people have done before going there and what time they woke up.
However, analyzing the data of visitors grouped by hours is fundamental both in the Mall and in the Retail sphere, to assess changes in opening hours or in the staff planning, for instance.
What we have reported is just a small taste of what we can do.
But nothing can be done if you don’t have the data! ?
Write a comment (Your email will not be published and will remain confidential)