
How did the 2022 sales start from the point of view of footfall in Shopping Centers? And in Retail Outlets? Let’s find out with Microlog data!
After a difficult closure of 2021, with the entire year closing at -25.5% of inflows on 2019 (see our indexes), there was much anticipation for the start of the winter sales, which kicked off on January 5 in almost all Italian regions.
As usual, we analyzed the Shopping Centers served by our people counters, considering the first 12 days of the 2022 sales (with two consecutive weekends), compared with the corresponding days of 2019 (pre-covid reference year).
We then went to see what differences there might be with Retail Outlets, again with Microlog people counting systems installed. What was their average performance compared to the Centers? Are there significant differences in attendance?
Shopping centers lose -25,4% in footfall over 2019
We compared the period “January 5-16, 2022” with the period “January 5-16, 2019”, so 12 consecutive days from the first day of sales. For both years, the range of days considered includes at least two weekends.
The drop in visitors to the Centers for the first days of the 2022 sales is -25.4% over 2019. A quite heavy data, but also quite expected considering the performance of the last months of 2021. The epidemiological situation, the resulting uncertainties and fears, and the stringent safety regulations continue to drive people away from walking in the malls.
To see this data in more detail we need to consider an aligned graph, with the alignment of the days of the week of January 2022 and January 2019.
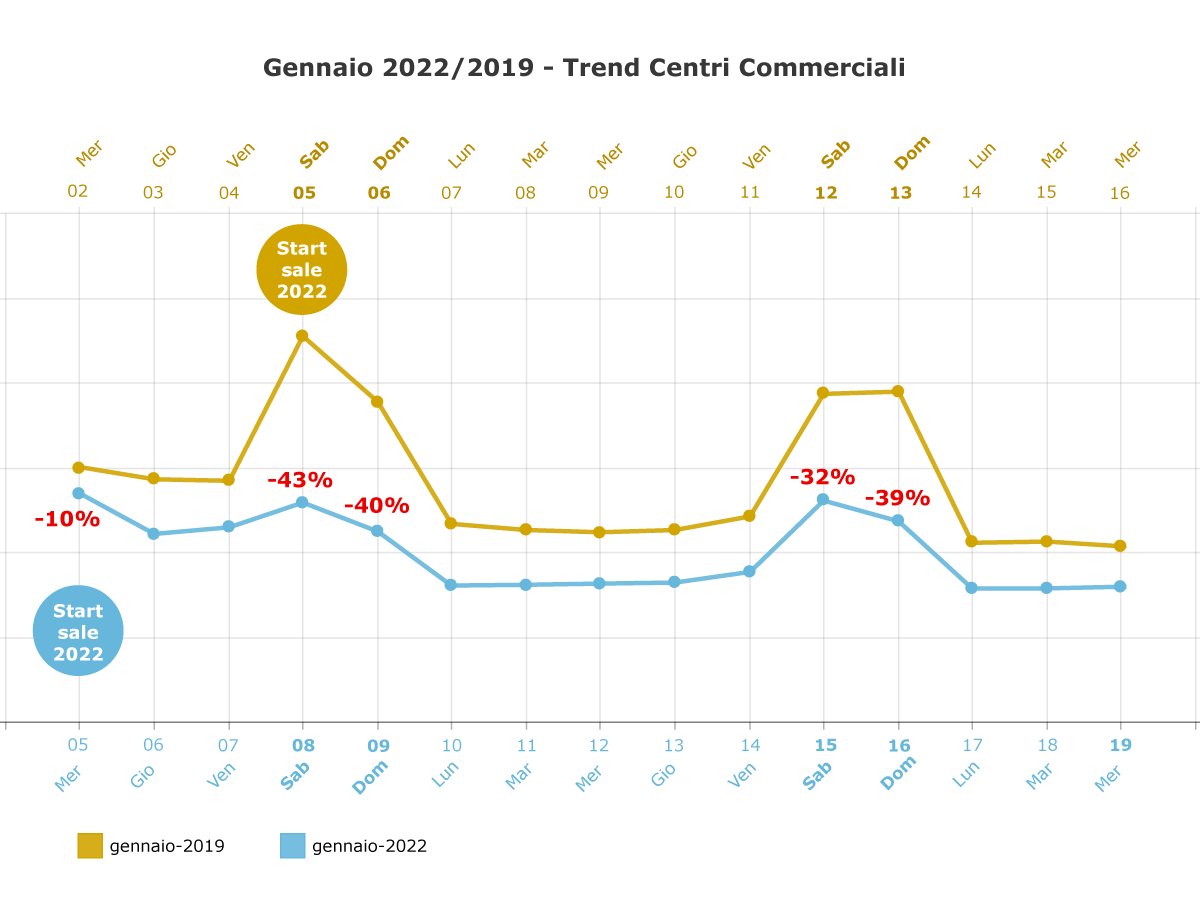
First of all, the chart suggests us an early advantage that 2019 may have had, with the start of the sales happening in Saturday, while this year it happened on the pre-Epiphany Wednesday (still a working day).
Compared to the aligned Wednesday of 2019, the first day of sales shows a decrease of -10%, the best result of the entire period considered. Thursday, January 6, a holiday and with the Shopping Centers open, did not show any peak compared to the weekday Thursday of 2019, indeed, the gap became more pronounced.
Continuing through the days of the week, we arrive at the first comparable weekend, with 2022 losing -43% of footfalls on Saturday (remember, the first day of the 2019 sales) and -40% on Sunday: a negative percentage the latter that does not change much even the following Sunday, while the second Saturday aligned reduces the contraction of footfalls to -32%.
Retail Outlet footfall lose -6,1% on 2019
Of a slightly different tenor is trend at the Outlets covered by our analysis. In the first 12 days of sales, our counting systems detect a limited percentage drop in visits compared to the pre-Covid year, with an average loss that stands at -6,1% (as we will see in a moment, mainly due to the very positive first days).
A first factor that can lead to a better data compared to the Shopping Centers is, in our opinion, the concept of Outlet itself: even more advantageous prices during sales, and a desire for maximum savings at a complicated time for the economy of Italian families.
A second factor may once again be linked to the pandemic, where prudence is the driving force behind certain choices made by people. Probably Retail Outlets, with their open-air promenades, create a greater perception of security than the closed galleries of Malls.
Even for the Outlets we go into more detail with an aligned graph:
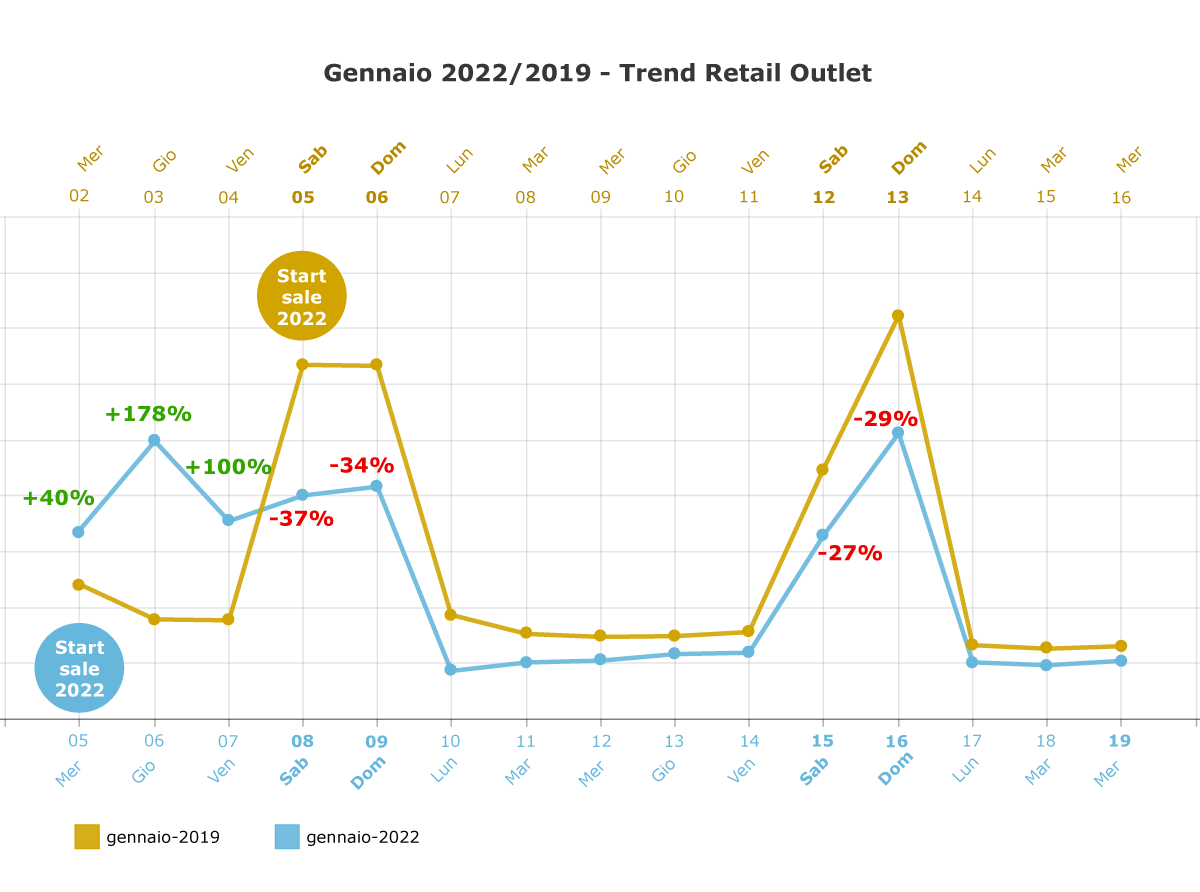
The positive peak on Wednesday, January 5, 2022 is quite evident, with a +40% over the 2019 aligned Wednesday, with further confirmation on Epiphany Thursday and Friday, days that see an increase over 2019 of +178% and +100%, respectively.
In contrast, the performance of the first aligned Saturday returns negative, with a -37% over the corresponding Saturday in 2019 (which, however, was the opening day of the sales); the first Sunday loses a -34%. The performance of the following weekend averages -28%.
Overall, we are witnessing better resilience of the Outlets than the Malls. We will see if this trend is confirmed in the coming weeks.
An interesting data: the permanence time in Malls and Outlet decreases
In Microlog we are able to elaborate for our customers personalized statistics on the permanence time. To complete this analysis we also wanted to see this data, to get an idea of how the visitors’ habits are changing in shopping centers. How long do they stay in mall in this beginning of sales 2022? Are there differences considering the Outlets?
To answer these questions we examined a panel of Shopping Centers served by our people counters, without the cinema variable; in the same way we analyzed some Retail Outlets with Microlog counting systems; and finally we evaluated if there were significant differences between the respective data.
Here’s what our analysis aligned by day of the week revealed:
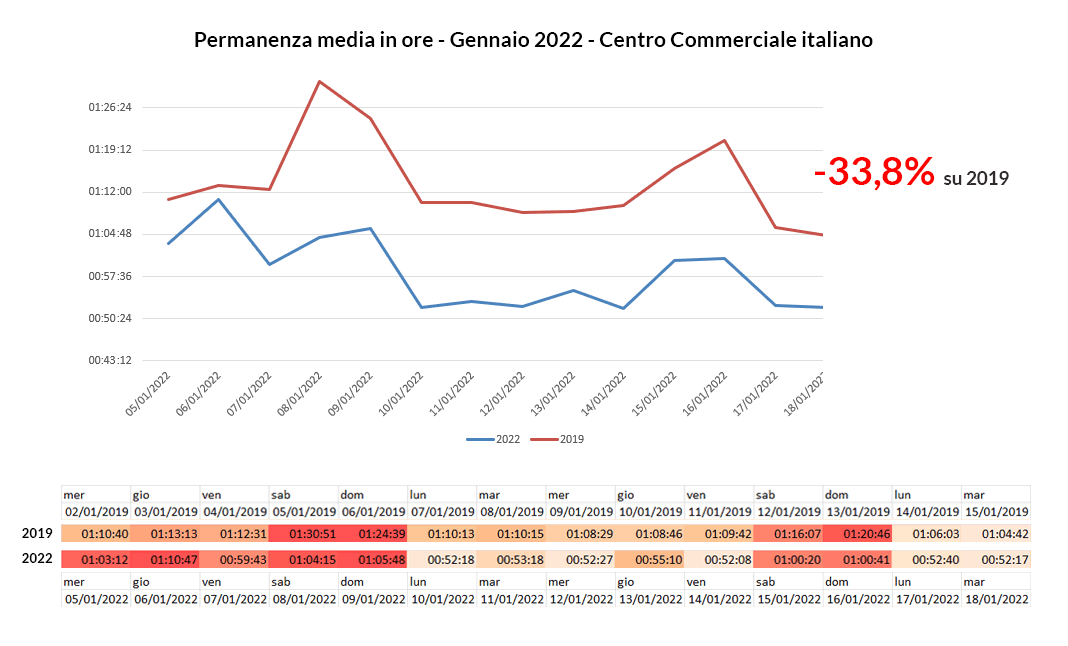
In the Malls we examined, the average 14-day dwell time in January 2022 fell by -33,8% compared to 2019.
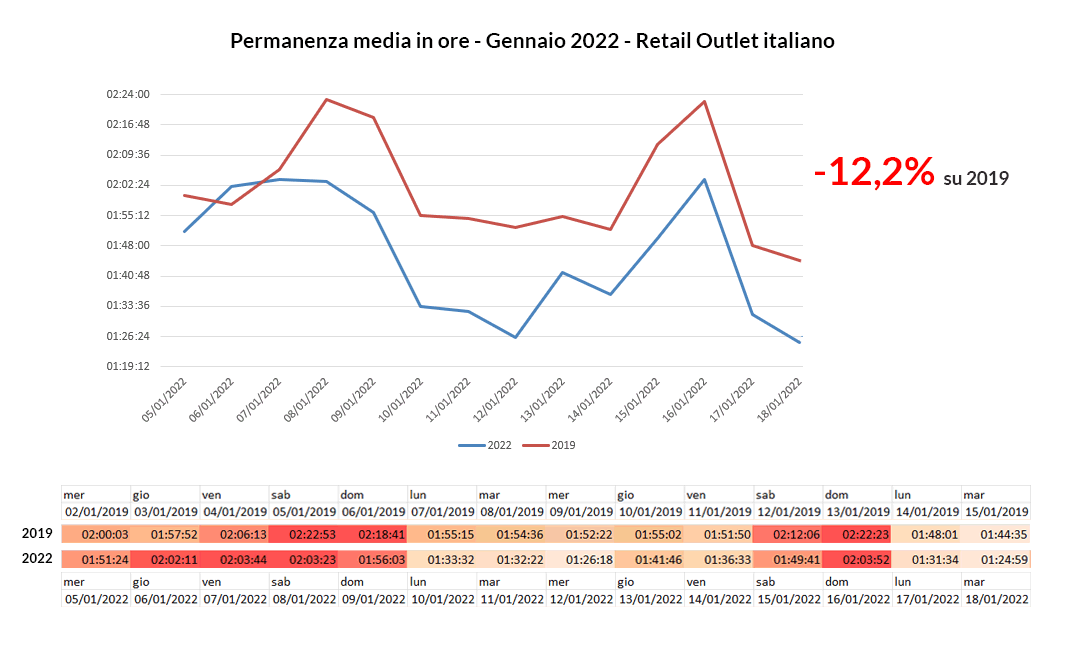
For the Outlets we analyzed, the drop in average dwell time for the period under review is -12,2%. A drop therefore less pronounced than for Shopping Centers.
In both cases, therefore, visits are somewhat shorter. This may be a sign of less dispersion, and probably a greater focus on concrete needs, such as buying something specific for which the price cut was awaiting. All this could lead to higher conversion rates.
Write a comment (Your email will not be published and will remain confidential)