
Christmas is coming and everyone, for one reason or the other, is waiting for it with restlessness. Someone can’t wait to unpack the gifts, while some other is waiting to spend some time with their families. Some people may get very much spiritual in this festive period, while some other is just yearning to cool down their frenetic working pace by relaxing at home…
Even here at Microlog we perceive the Christmas atmosphere and, curious as we always are, this year we’ve made ourselves a particular question:
how is the Christmas waiting period going in the Italian Shopping Malls?
We selected a sample of Shopping Malls which are distributed on our National territory. Giving a first glance at the daily total entrances during the month of December 2019, we noticed that, as every year, the people affluence is going up as Christmas approaches…

Not yet satisfied by this datum, we related total entrances of the two weekends before Christmas 2019 with those preceding Christmas 2018. In particular, we considered entrances from 9 am to 9 pm for:
- Saturday 14 December 2019 vs Saturday 15 December 2018;
Sunday 15 December 2019 vs Sunday 16 December 2018;
Saturday 21 December 2019 vs Saturday 22 December 2018;
- Sunday 22 December 2019 vs Sunday 23 December 2018.
For what concerns the variation of the entrances on a daily detail, the registered trend is decreasing, mostly focused on Sundays.
| Comparison | Percentual variation |
|---|---|
| Saturday 14 December 2019 vs Saturday 15 December 2018 | -3,26% |
| Sunday 15 December 2019 vs Sunday 16 December 2018 | -5,48% |
| Saturday 21 December 2019 vs Saturday 22 December 2018 | -3,42% |
| Sunday 22 December 2019 vs Sunday 23 December 2018 | -5,82% |
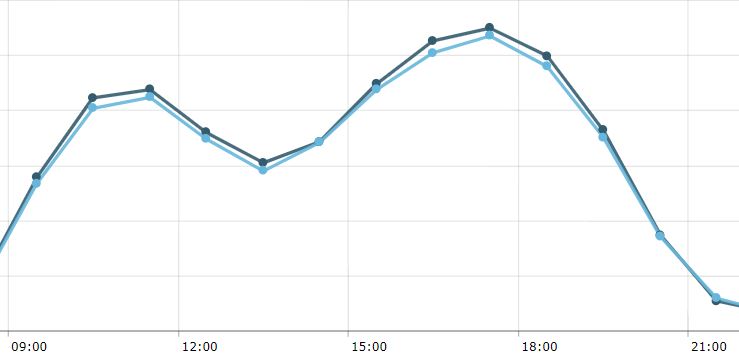
For those who would like to go in more depth on an hour basis, the graphics about the total entrances of the sample can be found in the following chart (images come from Microlog’s platform CheckinWeb). The light-blue curve shows the 2019 entrances, while the dark-blue one represents those of 2018.
| Comparison | Graphs on hour basis |
|---|---|
| Saturday 14 December 2019
vs Saturday 15 December 2018 |
 |
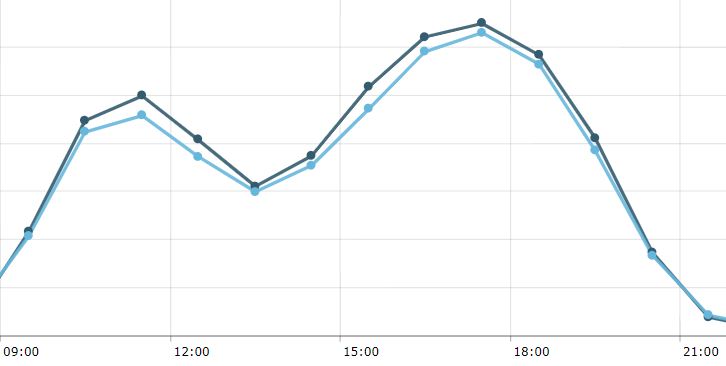
| Sunday 15 December 2019
vs Sunday 16 December 2018 |
 |
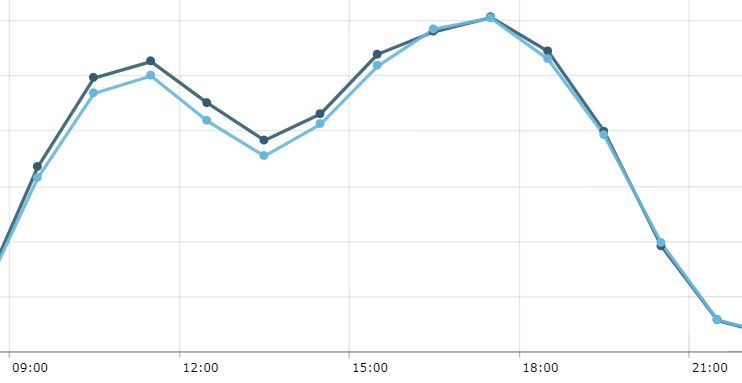
| Saturday 21 December 2019
vs Saturday 22 December 2018 |
 |
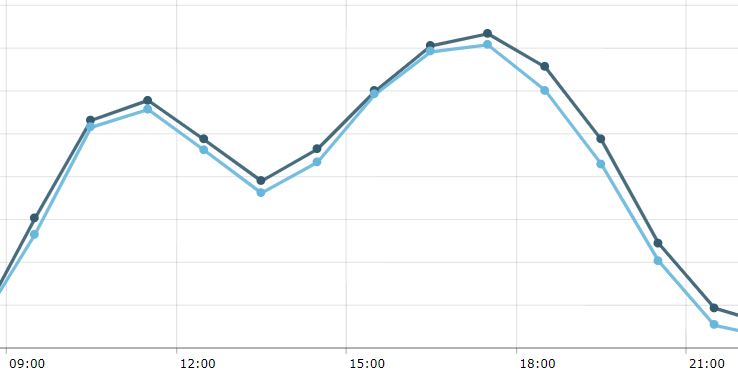
| Sunday 22 December 2019
vs Sunday 23 December 2018 |
 |
The relation between 2019 and 2018 shows us a drop of the entrances for the sample of Shopping Malls included. This decrease in entrances is being registered for the whole month of December: from Monday December 2nd to Sunday December 22nd 2019 there has been a drop of -4.53% related to the same period in 2018.
Another interesting datum is the every year Christmas approaching period. If we analyze Saturday and Sunday with the same days of the previous week for 2019 and 2018, we are able to notice that the increases in percentage are the same for both years.
| Comparison | Percentual variation |
|---|---|
| Saturday 22 December 2018 vs Saturday 15 December 2018 | 16,34% |
| Sunday 23 December 2018 vs Sunday 16 December 2018 | 18,67% |
| Saturday 21 December 2019 vs Saturday 14 December 2019 | 16,15% |
| Sunday 22 December 2019 vs Sunday 15 December 2019 | 18,25% |
The registered drops in entrances may be explained in many ways, one of which is that perhaps a stronger use of the digital channels might be used. Another hypothesis includes the Shopping Malls users anticipating their purchases during the Black Friday week.
Crossing the data of our people counters with revenues, every Mall is able to do focused analysis in order to investigate their peculiar reality, to discover new insights and, last but not least, to make strategic decisions.
Microlog remains at disposal in order to support any Shopping Mall that wishes to ask for our contribute.
We wish you a Merry Christmas and a wonderful 2020. May the new year bring you lots of surprises and very much satisfaction.
![]()
Write a comment (Your email will not be published and will remain confidential)